
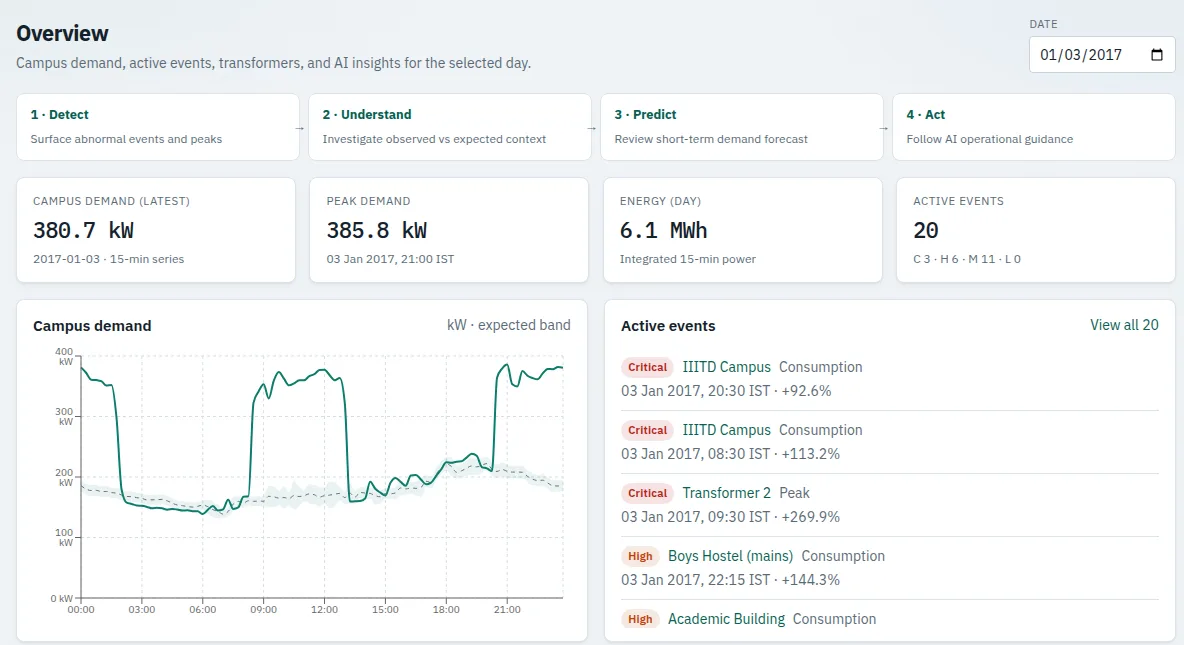
Which meters or facilities look unusual right now?
NirmaanAI · Energy intelligence by Tecell
Your energy data is telling a story. Are you seeing it?
Turn fragmented energy data into actionable intelligence. NirmaanAI helps energy organisations spot unusual patterns, understand demand and investigate operational issues with AI-assisted analytics.
For utilities, industrial & commercial energy users and smart-meter platforms.
The problem
Collecting energy data is not the same as acting on it.
Utilities and energy teams already capture vast meter and facility telemetry. The gap is turning that data into prioritised, evidence-backed operational decisions.
When will demand peak — and which contributors drive it?
Which anomalies should operators investigate first?
What does combining datasets reveal that siloed views miss?
How much of collected data actually becomes a decision?
Capabilities
Intelligence that links data to decisions.
Six capabilities you can explore in the live demo today — each labelled by maturity.
Maturity labels
- Live demoWorking today — explore it in the public live demo.
- Configured per deploymentConnected to your meters, systems and chosen SaaS or on-premises setup.
- RoadmapOn the product roadmap for upcoming releases.
Live demo
Smart-meter anomaly intelligence
- Problem
- Unusual consumption readings are hard to spot and investigate across many meters.
- What it analyses
- One-minute and aggregated consumption series from meters, buildings and campus entities.
- Insight
- Flags consumption patterns that deviate from expected behaviour so operators can investigate.
- What you can do
- Prioritise meters or facilities that look unusual and open an investigation view.
Live demo
Supply-quality analysis
- Problem
- Voltage, frequency and power-factor issues are easy to miss in raw telemetry.
- What it analyses
- Voltage, frequency and power-factor measurements where those signals are present.
- Insight
- Highlights supply-quality events that need operational attention.
- What you can do
- Review flagged supply-quality events alongside consumption context.
Live demo
Peak-demand intelligence
- Problem
- Peaks drive cost and stress, but contributors across meters are not always clear.
- What it analyses
- Demand peaks and the meters or entities that contribute to them.
- Insight
- Shows when peaks occur and which contributors matter most in the analysed window.
- What you can do
- Investigate peak windows and contributor mix before operational changes.
Live demo
Demand forecasting (15 min – 24 h)
- Problem
- Planning needs a forward view of demand with a sense of uncertainty.
- What it analyses
- Historical demand series used to forecast 15-minute to 24-hour horizons.
- Insight
- Produces demand forecasts with prediction intervals on the evaluated dataset.
- What you can do
- Compare forecasts against actuals and use intervals to frame operational expectations.
Live demo
Event prioritisation & investigation
- Problem
- Large event lists make it unclear which anomalies to look at first.
- What it analyses
- Detected events ranked Critical / High / Medium / Low with investigation context.
- Insight
- Surfaces a prioritised queue so analysts can drill into the highest-priority events.
- What you can do
- Open an event, review the series context and decide the next investigative step.
Live demo
AI-assisted interpretation (Ask NirmaanAI)
- Problem
- Raw charts and event lists still leave the “what does this mean?” question open.
- What it analyses
- Answers grounded only in the platform’s own analytical results (tool-grounded).
- Insight
- Explains events and suggests operational guidance — labelled as guidance, not automated control.
- What you can do
- Ask clarifying questions about a selected event and review recommended next checks.
Who it’s for
Built for the teams who own energy decisions.
Choose your segment to open a conversation with the right engagement type pre-selected.
DISCOMs & utilities
Unusual readings are hard to investigate; visibility of demand across meters and feeders is limited; it is unclear which anomaly to take first.
Capabilities that matter
- Smart-meter anomaly intelligence
- Peak-demand intelligence
- Event prioritisation & investigation
- AI-assisted interpretation
Outcome. A prioritised investigation queue across meters and feeders, so teams spend time on the anomalies that matter most.
Anomaly detection flags patterns for investigation — it does not establish theft, loss or root cause.
Industrial & commercial consumers
Unexplained consumption, costly peaks and fragmented site data make it hard to act with confidence.
Capabilities that matter
- Consumption anomaly intelligence
- Peak-demand intelligence
- Demand forecasting
- AI-assisted investigation
Outcome. A focused view of unusual patterns and demand behaviour across sites, ready to evaluate in a pilot against your baseline.
Value is measured against your own baseline during the pilot, so results are specific to your sites.
AMISPs & smart-meter platforms
Customers need analytics beyond collection and visualisation — without building every intelligence capability in-house.
Capabilities that matter
- Anomaly and peak intelligence layer
- Forecasting on meter data
- Investigation workflows
- OEM and white-label partnerships
Outcome. Embed energy intelligence alongside your metering or MDM offering through OEM and white-label partnerships; terms agreed per partner.
ESCOs & energy consultants
Client energy data needs faster, repeatable analysis without rebuilding tooling for every engagement.
A technology partnership to accelerate client analysis workflows.
System integrators
Energy projects need an analytics layer that can be scoped into joint pilots.
Deliver energy intelligence with your stack through a partnership engagement.
Renewable operators
Generation variability and forecasting needs are growing — renewable generation forecasting is on the roadmap.
Discuss renewable analytics needs against live-demo and roadmap capabilities.
Government energy organisations
Defined use cases must be evaluated with governed data and human-in-the-loop decisions.
A structured pilot for energy intelligence under programme constraints.
Evidence
Don't just read about energy intelligence. See it in action.
Open the live demo, inspect the metrics and walk through a real investigation on the I-BLEND campus dataset.
- 1Data
- 2Detect
- 3Understand
- 4Predict
- 5Act
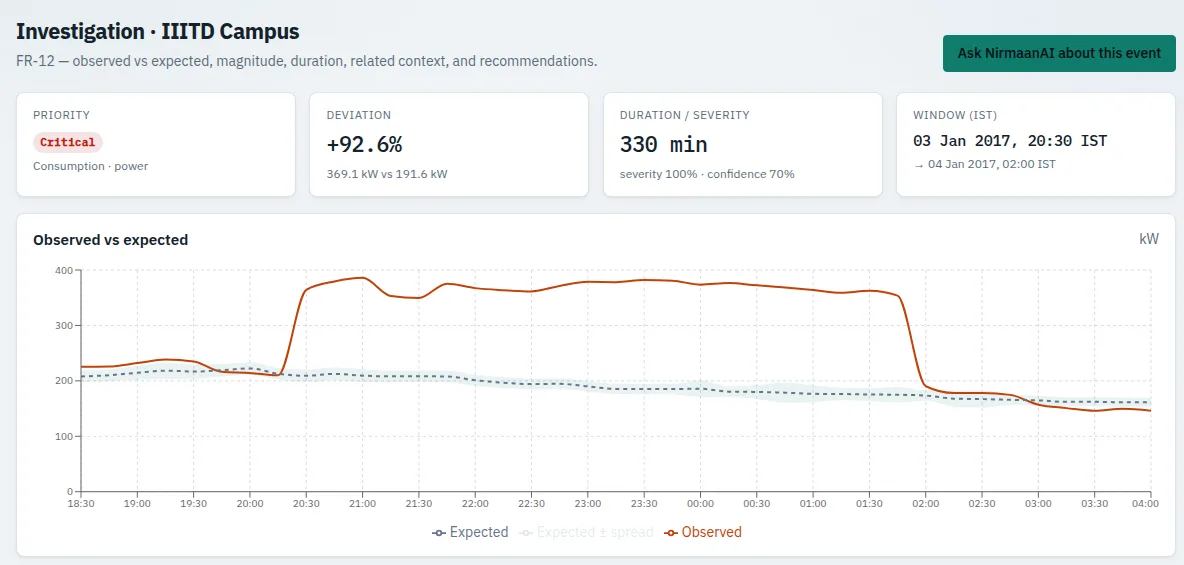
Worked example · evt_00008971
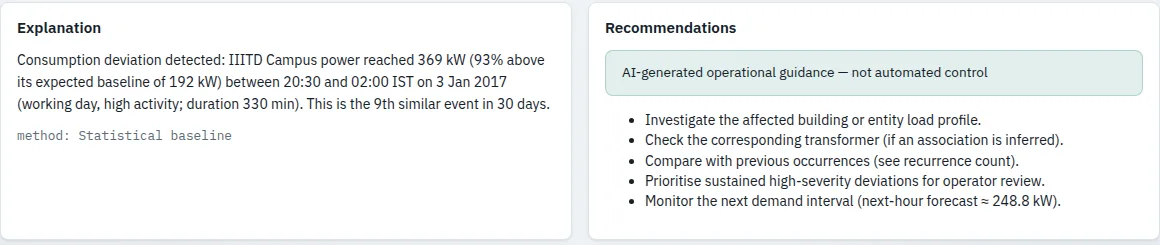
Campus consumption +92.6% versus expected — 369 kW observed vs 192 kW expected on 3 Jan 2017, 20:30–02:00. Prioritised Critical; 9th similar event in 30 days.
Investigate the prioritised event
The investigation view opens evt_00008971 with the consumption series, expected baseline and Critical priority.
Ask NirmaanAI for grounded explanation
Ask NirmaanAI returns an explanation and recommendations grounded in the platform’s analytical results — labelled operational guidance, not automated control.
Act on the finding
An operator uses the explanation to decide follow-up checks on site operations, metering or scheduling — human decision, not closed-loop control.
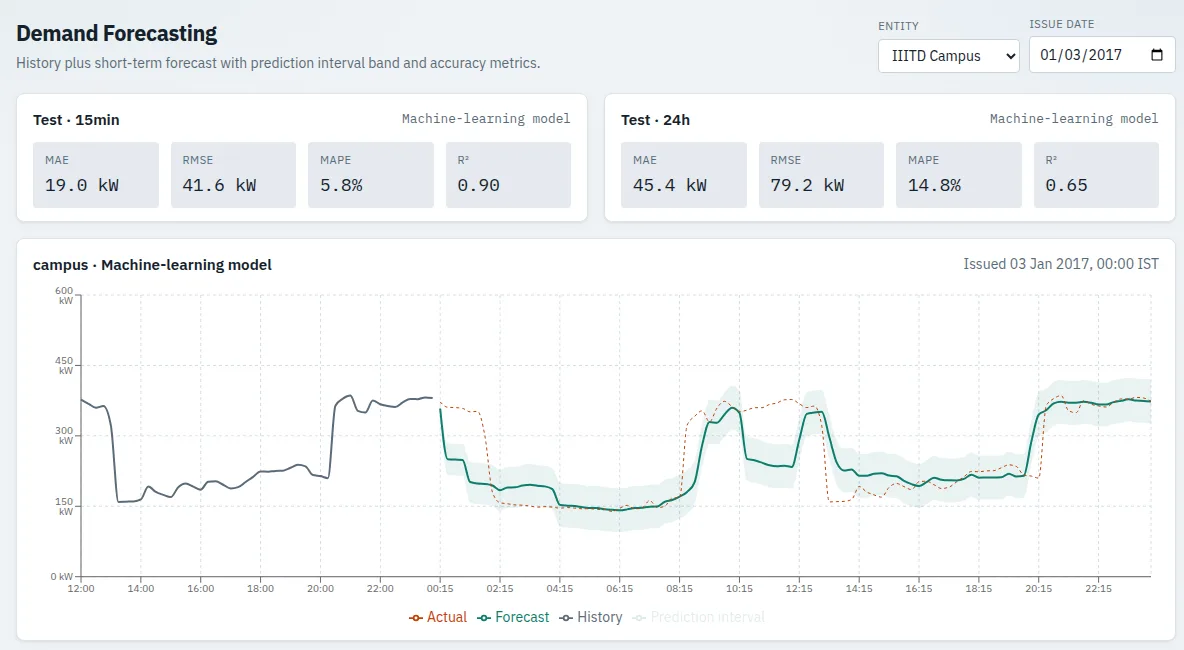
Demand forecasting on unseen data
15-minute to 24-hour forecasts with prediction intervals — evaluated on 2017 data held out from training.
Evaluation highlights
Measured on the public I-BLEND campus dataset.
25.1M
One-minute meter records
I-BLEND campus dataset (IIIT Delhi, CC0), 2013–2017
112M
Measurements across 13 entities
Buildings, 3 transformers and campus totals
0.82
Anomaly F1 (significant tier)
Precision 0.86 · recall 0.78 on injected anomaly evaluation
5.8%
Campus 15-min forecast MAPE
R² 0.90 on unseen 2017 data; 24-h MAPE 14.8%, R² 0.65
62%
Lower 15-min error vs seasonal-naive
Forecast evaluation on the public campus dataset
35,053
Events on the real data
Consumption 16,711 · peak 8,804 · supply quality 9,538
Offer
Free Energy Intelligence Assessment
Bring us one energy data challenge. Together we assess the relevant data, identify a suitable analytical use case and define how its value could be evaluated through a focused pilot.
Discussion covers
- Business problem
- Available datasets
- Data quality & readiness
- Use case
- Pilot scope
- Measurable success criteria
- Integration & deployment considerations
- What a later SaaS or on-premises rollout would need
A structured working session to shape your use case and pilot — free of charge.
Request your free assessmentHow engagement works
Start with your data. Validate the value before scaling.
Assess → Scope → Validate → Review → Decide — then a larger pilot or SaaS / on-premises rollout.
Assess
Clarify the business problem, available data and a suitable analytical use case.
Scope
Define pilot boundaries, success criteria, data handling and integration assumptions.
Validate
Run the focused pilot on agreed data and measure outcomes against the baseline.
Review
Inspect results with your team and decide what to scale next.
Decide
Expand the pilot or move to a SaaS or on-premises rollout.
What you get. A focused path from one energy data challenge to a measured pilot on your meters and sites — with SaaS or on-premises deployment options ready when you scale.
Integration & deployment
SaaS or on-premises — connected to your energy data.
Deployment options
- SaaS (cloud) deployment
- On-premises deployment
- Data residency and security arrangements confirmed during assessment
Configured per deployment
Integrations
Meter data, MDM / HES / BMS exports and APIs are connected as part of your deployment. File and API ingestion paths map into a unified energy data model so investigation, forecasting and Ask NirmaanAI run on your operational data.
Partnership
Add energy intelligence without building every capability yourself.
For AMISPs, ESCOs and system integrators — OEM and white-label partnerships are available; terms agreed per partner.
Explore a Technology PartnershipRoadmap
What’s next on the product roadmap.
Capabilities in development for utility deployments — ask us about early access.
Roadmap
AT&C loss intelligence
Analytical support for investigating aggregate technical and commercial loss patterns.
Roadmap
Revenue protection analytics
Tools to help revenue-protection teams prioritise unusual meter behaviour for investigation — not proof of theft.
Roadmap
Renewable generation forecasting
Forward views of renewable generation variability for asset and operations teams.
Roadmap
Grid congestion intelligence
Visibility into congestion-related demand and feeder stress patterns for planning discussions.
Roadmap
Expanded utility analytics
Broader utility analytics shaped with deployment partners.
FAQ
Questions teams ask before evaluating NirmaanAI.
Straight answers on the live demo, deployment options, partnerships and how to start.
What is NirmaanAI?
NirmaanAI is Tecell’s AI-powered energy intelligence platform. It helps energy organisations investigate anomalies, understand consumption patterns, anticipate demand and make more informed operational decisions — linking energy data to analytical evidence, not acting as a dashboard-only tool or a standalone chatbot.
Who is NirmaanAI for?
Primary audiences are DISCOMs and utilities, industrial and commercial energy users, and AMISPs / smart-meter platforms. ESCOs, system integrators, renewable operators and government energy organisations are also in scope for partnership or pilot discussions.
Can I try NirmaanAI now?
Yes. Open the live demo at nirmaanai.tecell.in, read the public testing report, or watch the demo video. The live demo runs on the public I-BLEND campus dataset (IIIT Delhi).
What evidence supports the analytics?
Evaluation on the public I-BLEND campus energy dataset (IIIT Delhi): 25.1 million one-minute meter records and 112 million measurements across 13 entities (2013–2017). Anomaly detection reached precision 0.86, recall 0.78 and F1 0.82 (significant tier). Demand forecasting on unseen 2017 data achieved campus 15-min MAPE 5.8% (R² 0.90) and 24-h MAPE 14.8% (R² 0.65), with 15-min error 62% lower than a seasonal-naive baseline. The live data shows 35,053 events. Full methods are in the public testing report.
Does anomaly detection prove electricity theft or loss?
No. Anomaly detection flags patterns for investigation — it does not establish theft, loss or root cause. Missing data is not reported as an anomaly.
How do we evaluate NirmaanAI on our data?
Request a personalised demo, or start with a Free Energy Intelligence Assessment: bring one energy data challenge, assess relevant data, identify a suitable analytical use case and define how value could be evaluated through a focused pilot. Engagement then follows Assess → Scope → Validate → Review → Decide.
What integration and deployment options are available?
NirmaanAI is offered as SaaS (cloud) and on-premises. Integrations with your meter data, MDM/HES/BMS exports and APIs are configured per deployment. Data residency and security arrangements are confirmed during assessment.
Is OEM or white-label available?
Yes. Available through OEM and white-label partnerships; terms agreed per partner.
What does Ask NirmaanAI do?
Ask NirmaanAI answers only from the platform’s own analytical results (tool-grounded). Every explanation or recommendation is labelled operational guidance, not automated control.
What is on the roadmap?
Roadmap capabilities include AT&C loss intelligence, revenue protection analytics, renewable generation forecasting, grid congestion intelligence and expanded utility analytics.
Next step
Your next energy insight could start with one conversation.
Tell us about your meters, sites or platform — and whether you want a personalised demo, a focused pilot discussion or a technology partnership conversation.